2020. 5. 30. 20:47ㆍPHP
https://developers.google.com/web/tools/chrome-devtools/network/understanding-resource-timing
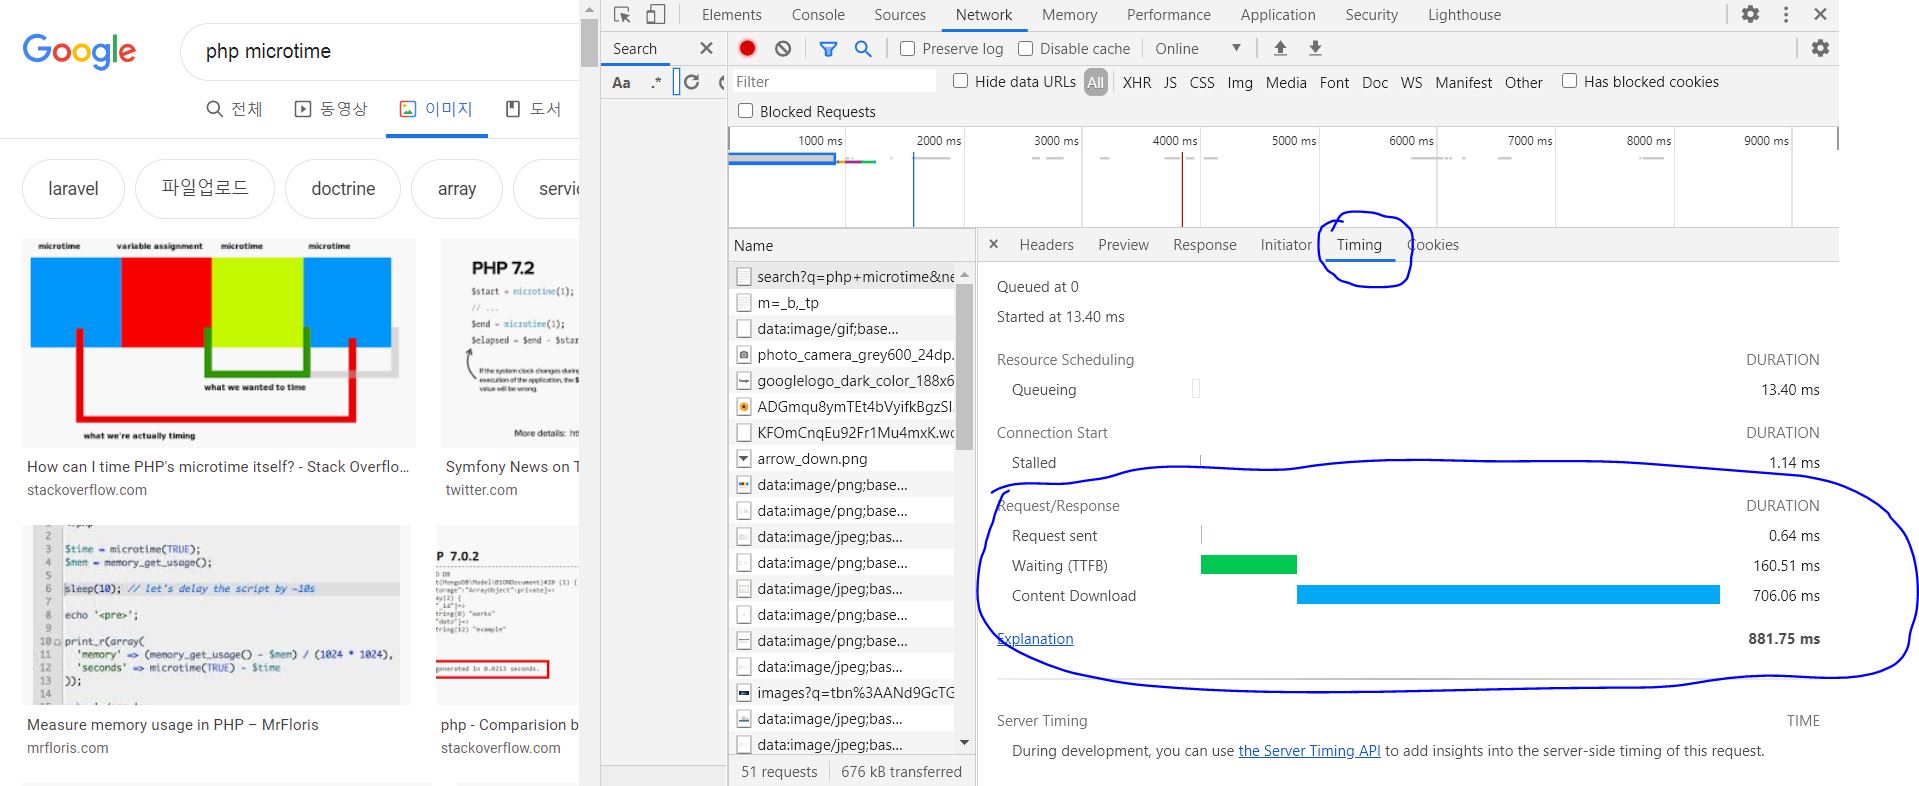
Request Sent / SendingTime spent issuing the network request. Typically a fraction of a millisecond.
Waiting (TTFB)Time spent waiting for the initial response, also known as the Time To First Byte. This time captures the latency of a round trip to the server in addition to the time spent waiting for the server to deliver the response.
Content Download / Downloading Time spent receiving the response data.
웹페이지 로딩이 너무 느려서 디버깅 시도.
방법1. php microtime : return current Unix timestamp with microseconds
문제가 될법한 코드의 전후로 print_r(microtime) 찍어서 시간간격이 어느정도 걸리는지 확인한다.
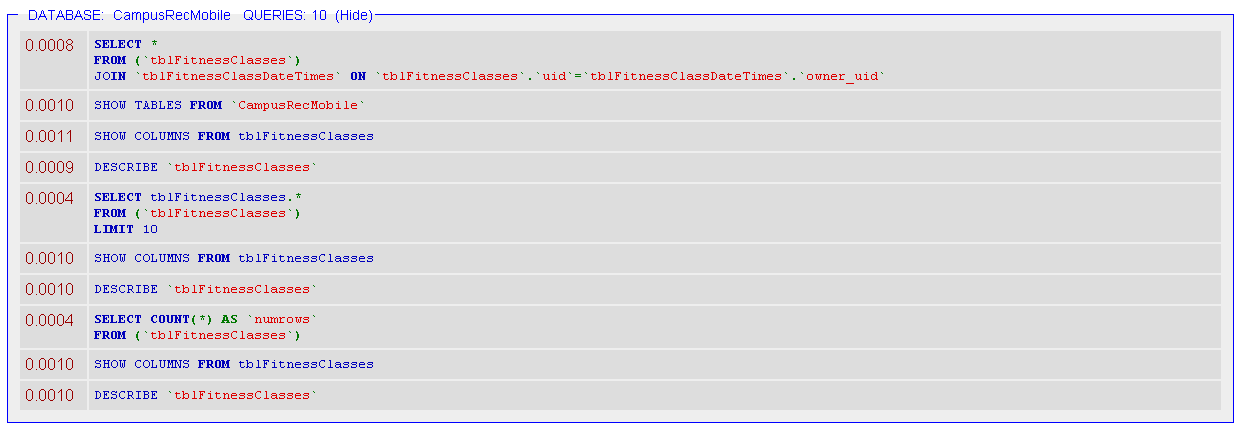
방법2. codeigniter profiler : $this->output->enable_profiler(TRUE);
다음과 같이 출력되는 정보를 보고 문제의 원인을 찾아본다.
profiler 말고 benchmark를 사용하는 방법도 있다고 한다.
http://www.ciboard.co.kr/user_guide/kr/libraries/benchmark.html
쿼리문 실행 결과를 가져오는데서 문제가 있는 것 같은데 내가 해결할 수 있는 수준이 아니라 넘어감.
'PHP' 카테고리의 다른 글
| vscode html 속 php 하이라이트 (부제: vscode syntax highlighter) (0) | 2020.07.09 |
|---|---|
| php $_SERVER['http_referer'] 용도 (0) | 2020.06.07 |
| session_start() 로컬호스트 연결 에러 ERR_CONNECTION_RESET (0) | 2020.01.23 |
| PCRE functions, php 정규표현 관련 함수 (0) | 2020.01.15 |
| $_SERVER (0) | 2020.01.15 |